
Trutina system learning center – Part 1.
We at Gremon Systems, are fully committed to supporting our clients so that they can use the Trutina system the most effective and most productive way.
We do believe that the Trutina system offers unique opportunities to the world by the direct monitoring of the plants. These opportunities must be integrated into the daily routine plant management activities.
Summing up the experience of recent periods, we have come to the decision to deal with certain topics, by which we can make the use of the Trutina system more understandable to everyone.
First let’s start with the Dashboard information – this data visualization interface had been created to make the interpretation of data simpler. How can we recognize simply and quickly whether everything is all right with our plants or not?
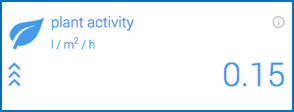
Plant activity shows the amount of water evaporated by the plants in one m2 in the previous hour.
The trend of plant activity is worth examining. If the UP sign points upwards, we know that our plants have become more and more active lately, they have absorbed and evaporated more and more water. This shows us that the environmental conditions have been favourable.
In case this trend turns, and the sign points downwards, we need to examine the cause of the slowdown of the water uptake of the plants. This can be caused by too little light, high concentration of vapour or low temperature.
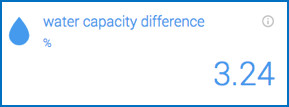
The water capacity difference number shows in percentage the water loss of the substrate due to the plants’ water uptake and the drain since the last irrigation was finished.
The number indicating the moisture content of the slab is also a user-friendly indicator, as being conscious of our irrigation strategy (vegetative versus generative), we can easily follow the actual state of the moisture content of the slab. If this is a larger number, it means that the slab is drier. Our opinion is that 18.42% is an extreme generative effect.
On the dashboard, there is information about the daily irrigation status as well. The irrigation-related activities since sunrise are easy to understand.
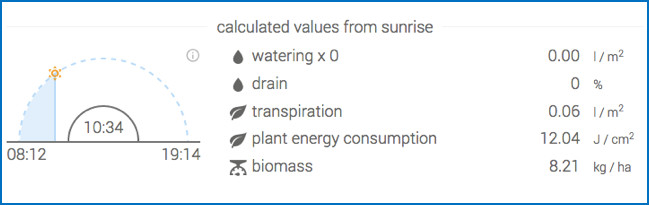
If we see that there has not been any irrigation after sunrise and it’s been a long time since then, we need to check the plant activity in any case, that is how much water has been evaporated. If there has only been a small amount of evaporation, and at the same time, there is no significant difference from the last irrigation cycle of the previous day then we can wait a little longer in line with the vegetative-generative strategy.
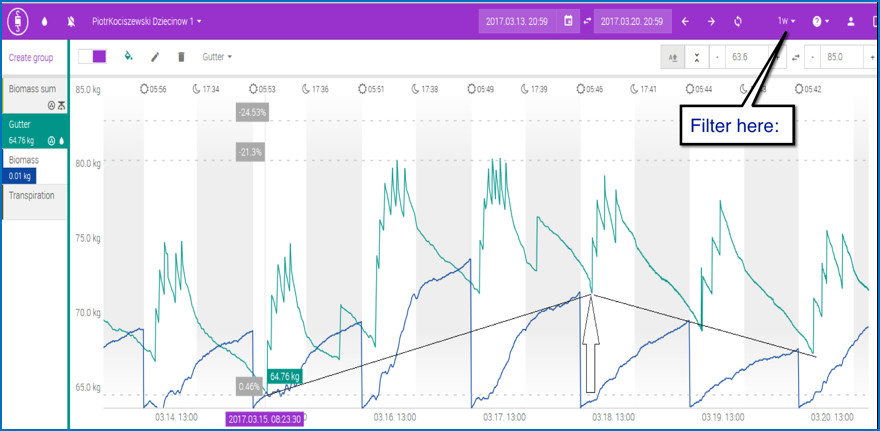
The Trutina software offers different setting options to the users. You can set the timeframe you want to review. You can choose which data you wish to assess. The different views menu option provides support in making different decisions. With its rational use, it offers better understanding of the different correlations.
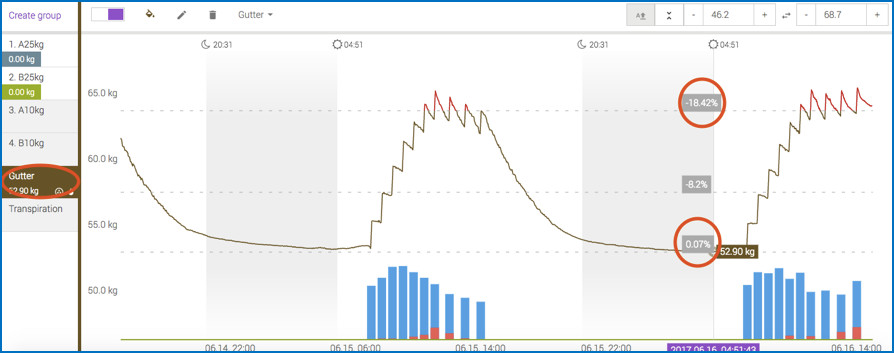
Weekly view: This example shows that during the given week (in the middle of March) it was difficult to determine the suitable irrigation strategy due to the changing weather conditions. The humidity of the slab was lower at the beginning of the week, then in the middle of the week, water capacity has been increased by a night-time irrigation and by several higher doses of irrigation cycles.
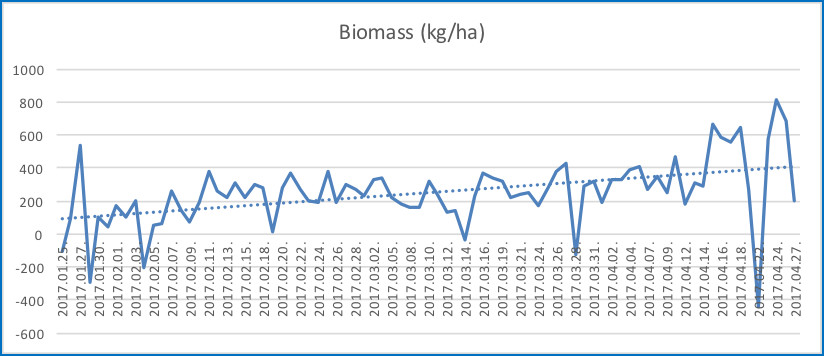
It can also be seen that on the days when the value of water capacity was more suitable, biomass production was also higher. It is also clear, that the lack of night-time irrigation, together with the fewer number of irrigation cycles resulted in the drying of the slab – 10% in two days -, which caused stress, and due to which the humidity of the slab has decreased to such extent that it was way under the level of easily absorbable water.
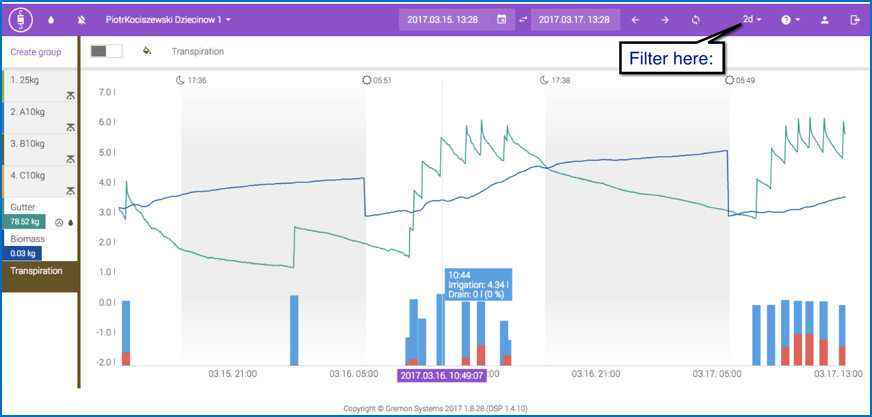
The two-day or shorter views also show the amount and frequency of the irrigations. In this specific case, the two consecutive irrigations helped achieve the desired effect.
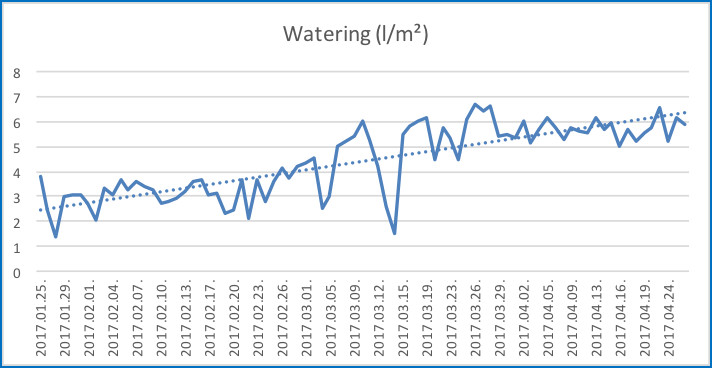
Our research clearly shows that the amount of irrigation water and biomass production are closely and positively correlated. Therefore, it is advisable to determine the amount of irrigation water in such a way that the water capacity of the slab would not go under the value indicating the easily absorbable water, as this is what balanced biomass production means.
If you need more information please contact us.