Case Study: Trutina Soil – Irrigation Strategy in Soil
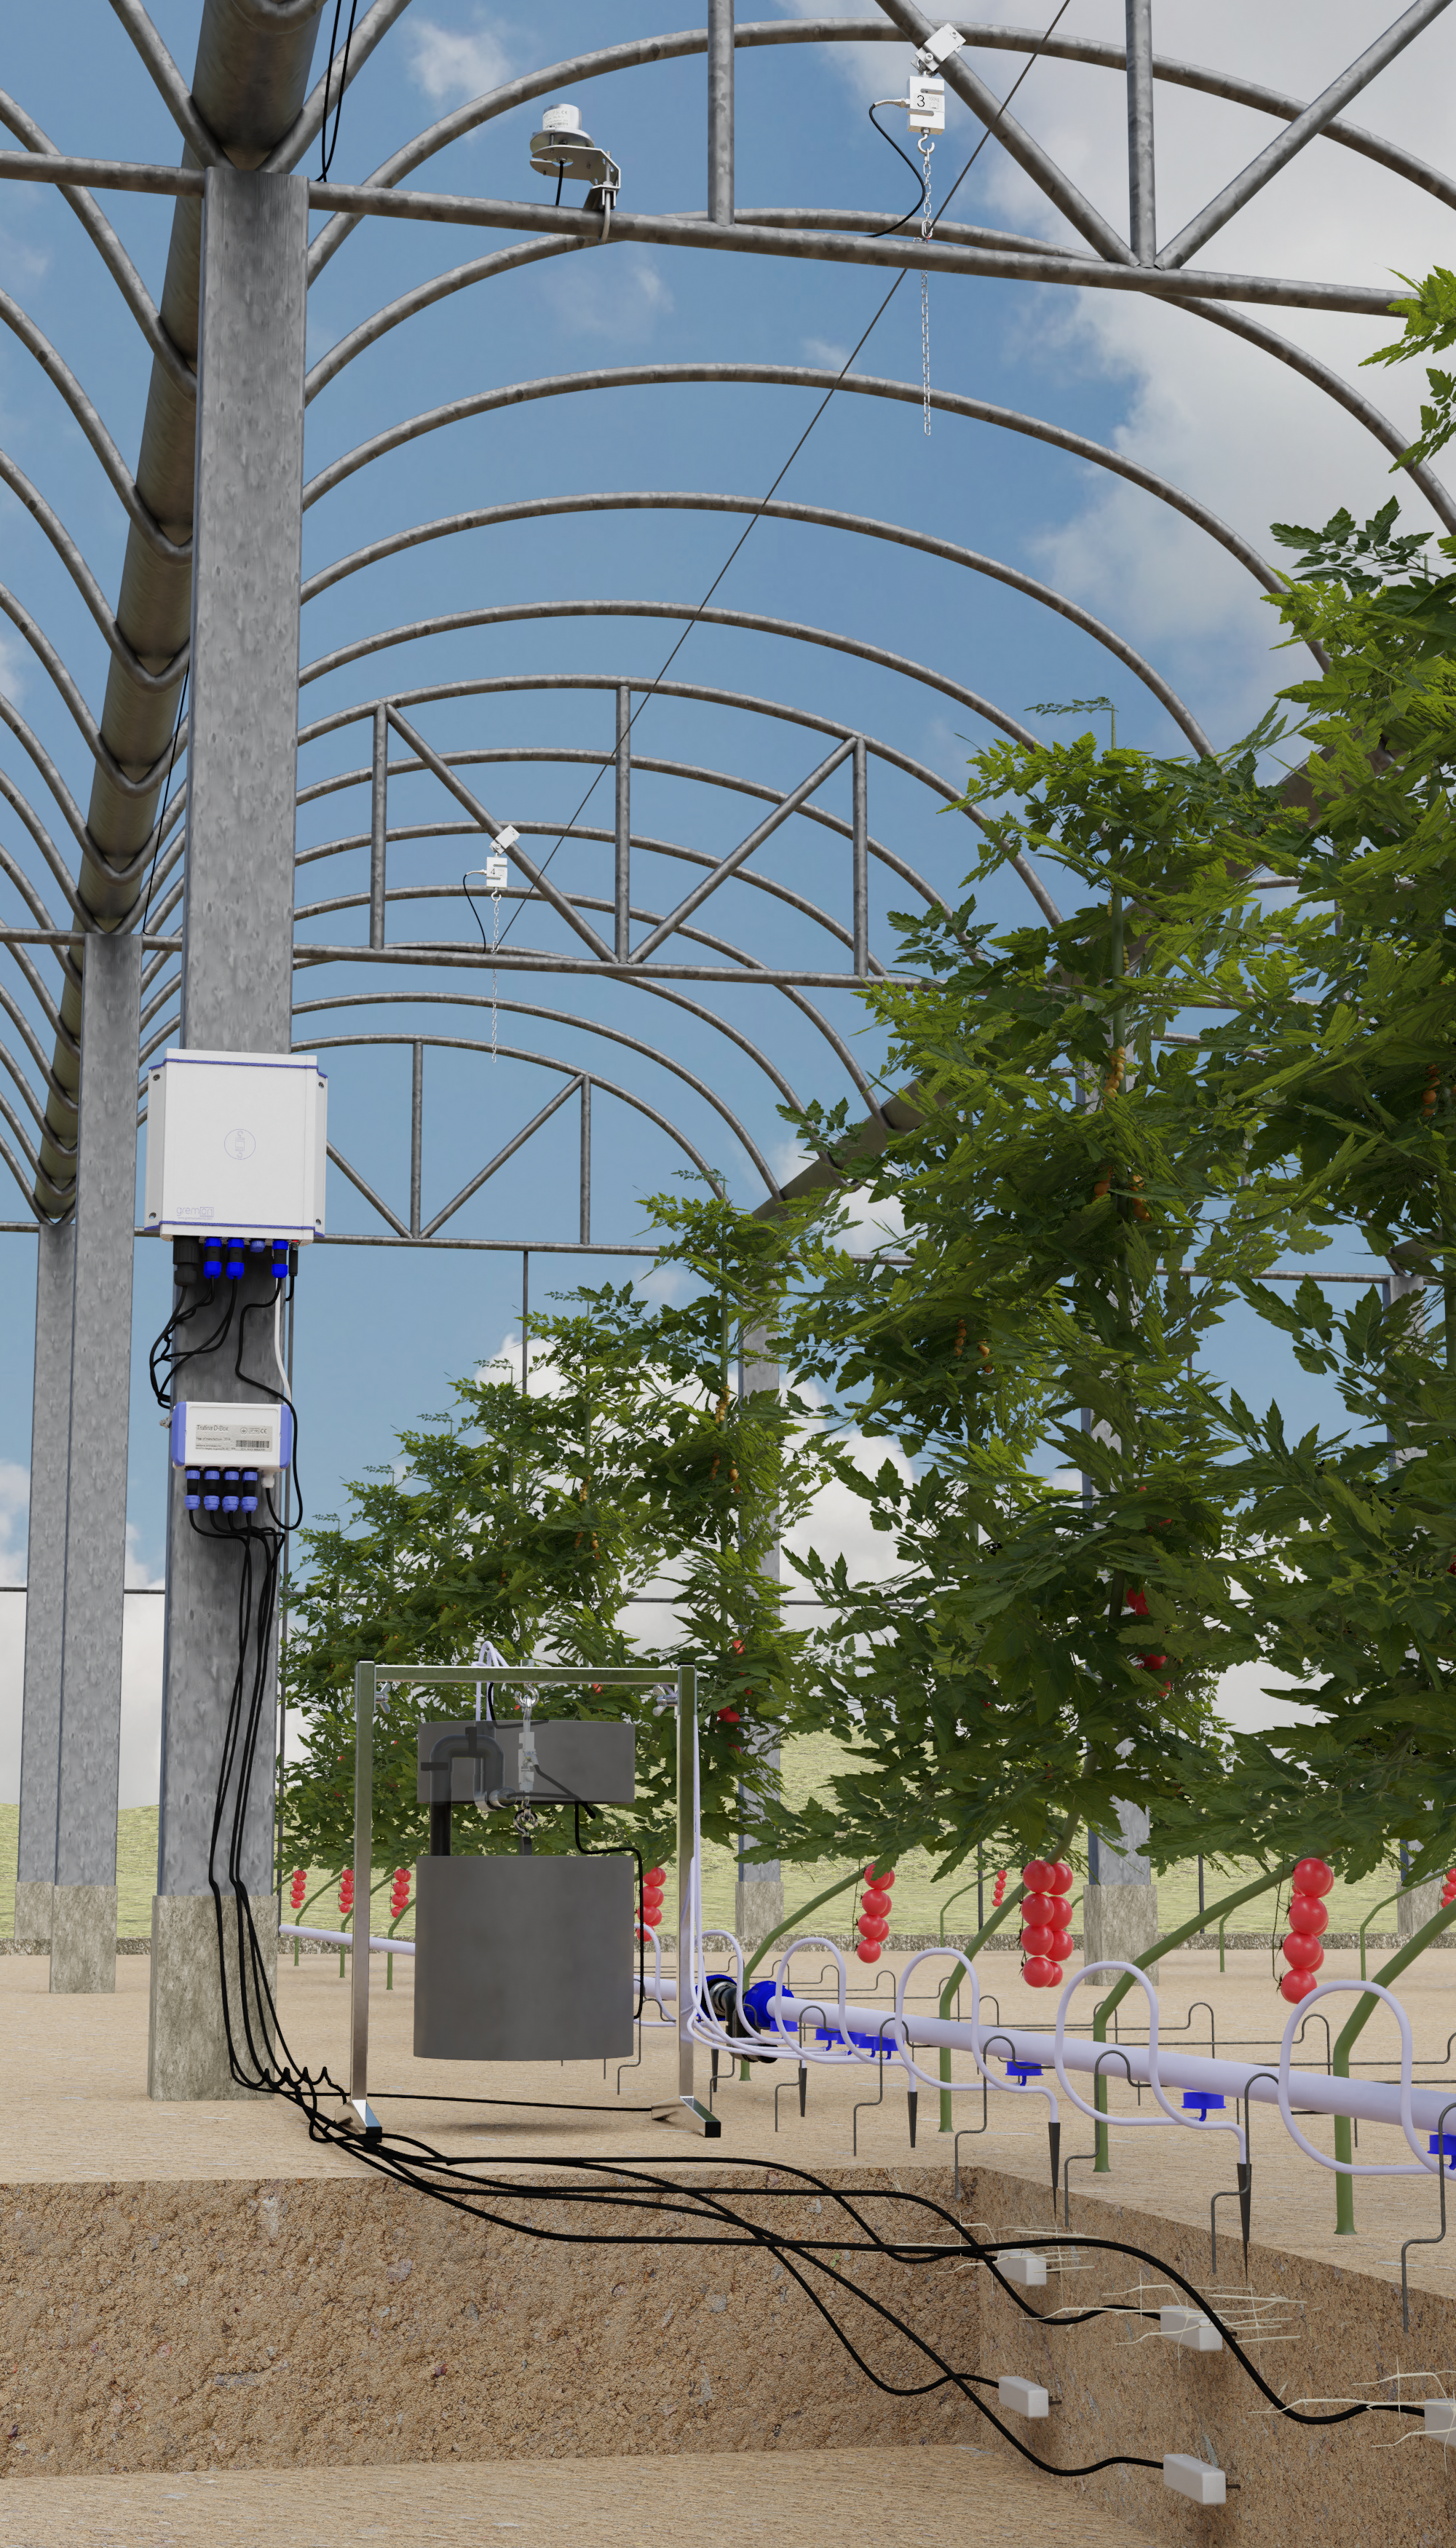
Number of soil moisture (EC, Temp.) sensors may vary depending on customer needs.
These sensors must be placed in different soil depths, our recommendation is 15 and 20 centimeters, but it is very dependent on the local soil conditions.
We are going to display the relevant values on the brand new Trutina Soil dashboard which will help growers decide when and how much they need to irrigate in order to optimize the nutrition dosage.
The growers have the possibility to enter reference values (max-min) and then they only need to keep the “meter” in between those, they can set these values according to the local conditions and their experiences.
If the values are under the minimum level, it is necessary to irrigate. Above the maximum level, there is no need for irrigation.
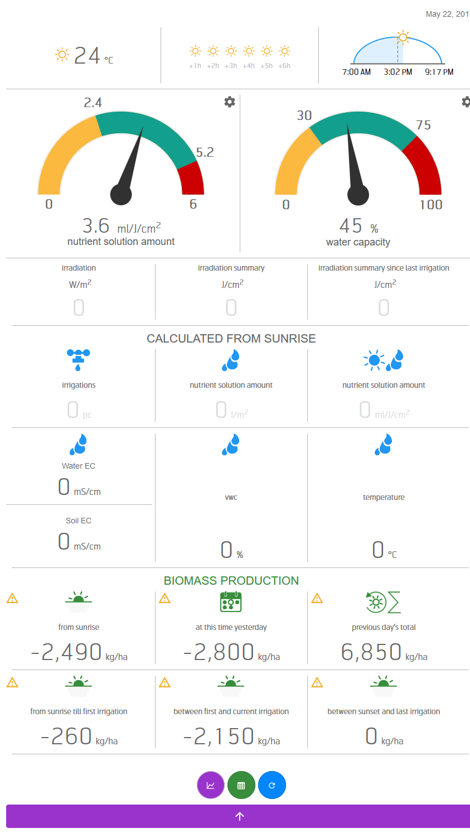
One of the most important indicators is the ratio of irrigated water and radiation (ml/J/cm2). There is a standard value around 3 ml/J/cm2 that a plant can normally transpire throughout the day. So, if a grower can keep his value around this, he can secure a good irrigation strategy.
Additionally, there is another indicator, the soil moisture level (VWC), which has an optimum level depending on the local soil conditions. The optimum level can be set after fine-tuning the irrigation strategy. The goal is to find out how many irrigations does a grower need to keep the meter in between the adjusted (max-min) level, and what amount he neeeds to irrigate?
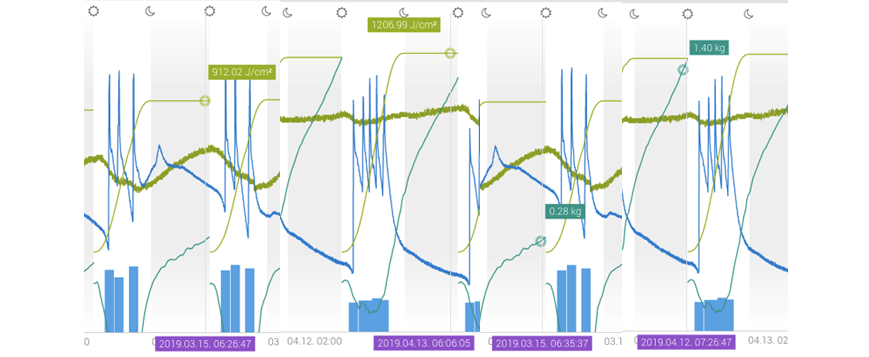
Biomass – when the plants are in balance, it is important to try to keep the biomass growth as linear as possible. Of course, it depends on the local conditions (geographical, technological etc.).
In practise, when a day’s biomass is in “– “level for longer period, the plants try to compensate the stress after the radiation becomes lower. But in this case the transpiration is going to be lower as well tmeaning the plants are “sucking” water, which requires extra energy. This is an energy robbing process; it should always be avoided.
It is also possible to view details and graphs for deeper analysis. This can help in following the influence of changes in the irrigation strategy.
Shown below is a nice case study, which is a perfect example of how useful and valuable it is to use Trutina Soil:
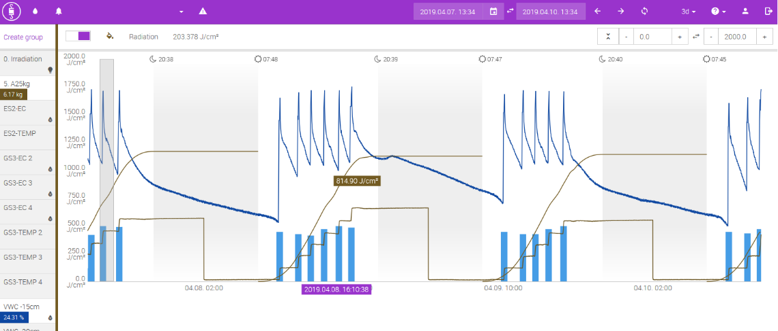
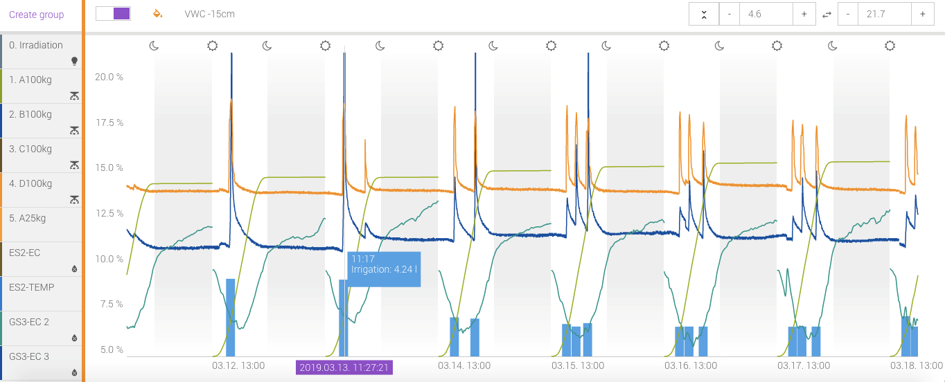
The screenshot below displays the irrigation strategy of tomato production in soil, during the first seven days, right after installation.
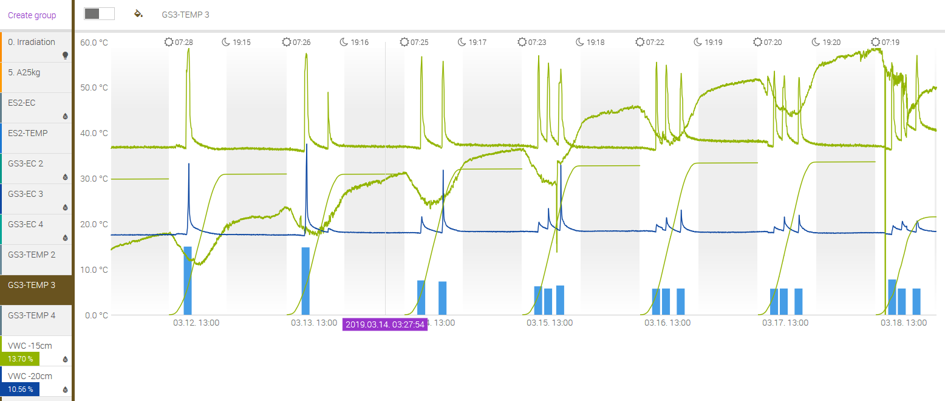
(Blue line in the chart: sensor 20 cm deep)
(Green line in the chart: sensor 15 cm deep)
During the first few days it can easily be seen that the sensor 20 cm deep (blue) shows a high value during irrigation, since most of the water was irrigated in one dose. At the same time the sensor 15 cm deep (green) is detecting overflow, water leaving the root zone, this amount is totally unreachable for the plant.
This is an extremely wasteful practice!
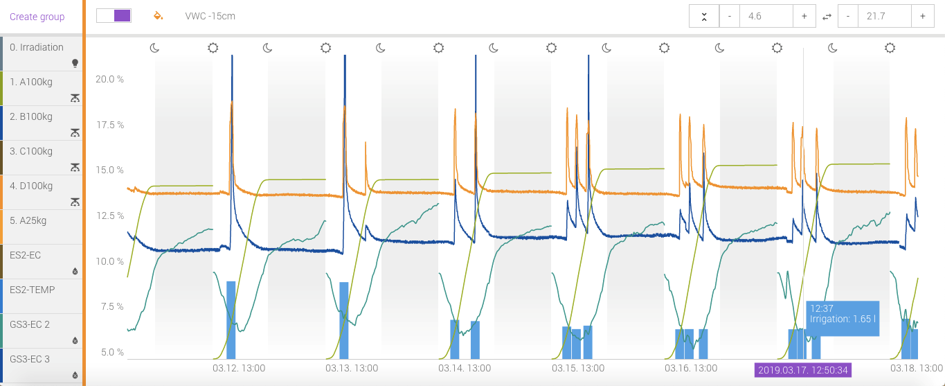
In the next few days, the grower irrigated two, then three smaller doses of water, the sensor 20 cm deep is registering smaller measured values.
How can the growers track how much water is necessary?
The one-time a day water dose was 4.24 liters through the three-piece drip irrigation units.
The three-time a day water dose was three times 1.65 litres = 4.95 litres, through the three-piece drip irrigation units
Later, the daily water dose was given four times at four times 0.72 litres = 2.88 litres, therefore they’ve saved more than 30% of water and fertilizer (4.24 litres versus 2.88 litres).
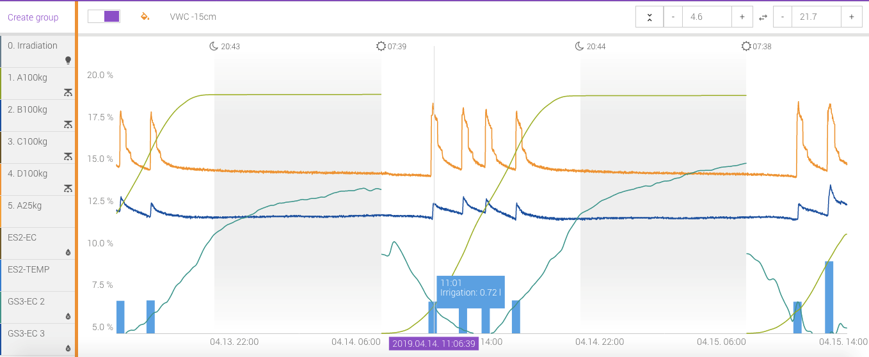
30% is already a lot even though the plants got bigger and the biomass production was 5 times higher (0.28 kgs versus 1.40 kgs). On top of all, the temperature and the irradiation has increased, which theoretically means a higher plant activity, which would mean higher water demand.
After optimizing the irrigation strategy of soil tomato production, we have been able to set up a soil water content level, which is identical to the substrate water content level in hydroponic production.